.webp)
.png)


.webp)
.svg)


TL;DR
- Customer retention begins with understanding why customers stay or leave, and then taking action to keep them.
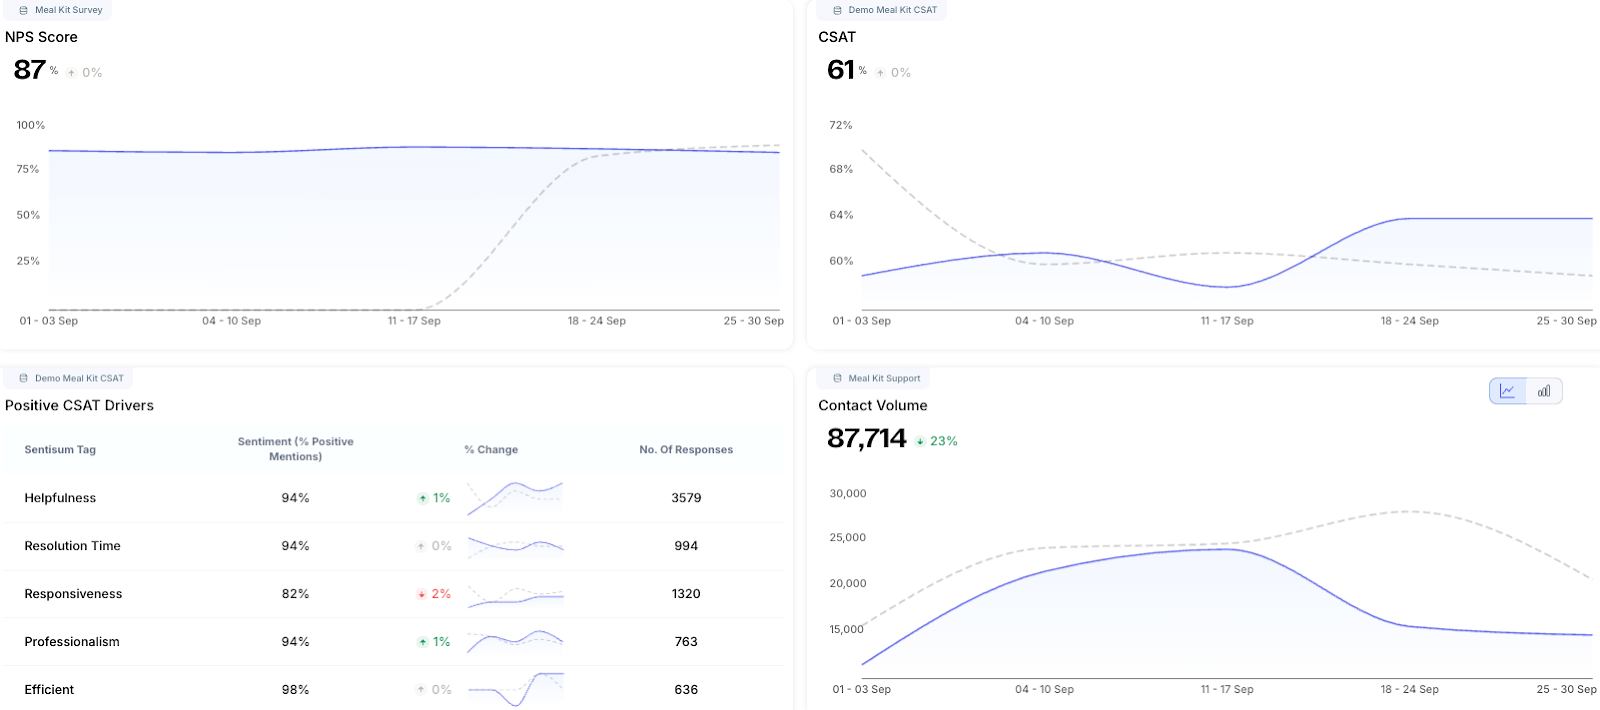
- Track key metrics: NPS, CSAT, churn rate, CLV, and retention rate to measure satisfaction and loyalty.
- Collect data from multiple sources, such as tickets, surveys, reviews, and product usage, for a complete picture.
- Use predictive analytics to identify at-risk customers and anticipate churn before it happens.
- Segment customers and tailor retention strategies based on their behavior, value, or level of engagement.
- Act quickly on insights to resolve issues, improve experiences, and strengthen loyalty.
- As an AI-native VoC platform, SentiSum enhances retention by providing real-time feedback analysis, churn prediction, anomaly detection, automated tagging, and Kyo, SentiSum's AI agent, which highlights anomalies, detects churn risks, and suggests next-best actions in real time.
Losing a customer often happens quietly, with a single unresolved issue or one overlooked signal, and a loyal buyer may be gone.
Every churn signal has a cost. For most brands, it’s hidden in customer conversations and insights they never analyze.
Customer retention analytics software turns this insight into action. By analyzing support tickets, surveys, reviews, and other data, it uncovers patterns, flags risks, and helps businesses take action before churn occurs.
In this article, you’ll learn the key metrics to track, how predictive analytics can guide retention strategies, best practices for using retention data effectively, and how SentiSum transforms raw feedback into actionable insights that keep customers engaged and happy.
5 Key Metrics in Customer Retention
Here are key metrics to track that indicate customer satisfaction, likelihood of retention, and the value they bring.
1. Net Promoter Score (NPS)
NPS measures loyalty with one simple question: “How likely are you to recommend our product or service to a friend or colleague?” Answers are given on a 0–10 scale, then grouped into:
- Promoters (9–10): Loyal advocates who are most likely to recommend you.
- Passives (7–8): Satisfied but unenthusiastic customers.
- Detractors (0–6): Dissatisfied customers at risk of leaving or spreading negative feedback.
- Formula: NPS = % of Promoters – % of Detractors
Net Promoter Score matters because recommending a product implies a deep level of trust and satisfaction. A high score signals not only loyalty but also growth potential since Promoters often bring in referrals.
Businesses use NPS to guide retention strategies: Promoters can fuel word-of-mouth campaigns, Passives can be nurtured into becoming more loyal, and Detractors can be given attention to prevent churn.
NPS is also a quick and standardized benchmark across industries, making it easy to compare your performance with that of your competitors.
2. Customer Satisfaction Score (CSAT)
CSAT tracks how satisfied customers are with a specific interaction, like a purchase, delivery, or customer service call. Customers usually respond on a 1–5 or 1–7 scale to a question such as: “How satisfied were you with your experience today?”

- Formula: CSAT % = (Number of satisfied responses ÷ Total responses) × 100
CSAT provides immediate, actionable feedback. If your support team resolves an issue but receives low CSAT scores, you know right away that the resolution isn’t meeting expectations.
This allows you to make quick adjustments, such as retraining staff or improving processes, before minor frustrations grow into churn.
Unlike NPS, which measures overall loyalty, CSAT captures satisfaction at critical touchpoints in the customer journey. By regularly monitoring CSAT, you can ensure that every interaction contributes positively to long-term customer satisfaction and retention.
3. Churn Rate
The churn rate indicates the percentage of customers who cease doing business with you over a specified period.
- Formula: Churn Rate = (Customers Lost ÷ Customers at Start of Period) × 100
A high churn rate means customers are leaving faster than you’re retaining them, which directly impacts revenue growth. For subscription businesses, even a slight increase in churn can significantly reduce profits over time.
Tracking churn helps you determine whether retention initiatives such as enhanced onboarding, loyalty programs, or improved product features are effective. It also forces you to dig deeper into why customers are leaving.
By segmenting churn data (e.g., by customer age, product usage, or support history), you can identify patterns and address specific problems driving attrition.
4. Customer Lifetime Value (CLV)
CLV estimates the total revenue a customer will bring in during their relationship with your business.
- Formula: CLV = Average Order Value × Purchase Frequency × Customer Lifespan
CLV helps you answer questions like: “How much can we afford to spend to acquire and keep a customer?” and “Which customers are most valuable to our business?”
A high CLV relative to your Customer Acquisition Cost (CAC) means your business model is sustainable, you’re not just attracting customers but also keeping them long enough to generate real value.
CLV also guides resource allocation: for example, you might invest more in retaining high-CLV customers with personalized support, while designing more automated solutions for low-CLV segments. Without CLV, businesses risk overspending on acquisition and underspending on retention.
5. Retention Rate
The retention rate measures the percentage of customers who continue to do business with you over a specified period of time.
- Formula: Retention Rate = ((Customers at End of Period – New Customers) ÷ Customers at Start of Period) × 100
A high retention rate indicates that customers are satisfied, loyal, and perceive long-term value in your product. A low rate signals dissatisfaction, poor product-market fit, or competitive threats.
Retention rate also has a substantial financial impact: retaining existing customers is much cheaper than acquiring new ones, and higher retention usually increases CLV and overall revenue.
By consistently tracking your retention rate, you can measure the effectiveness of your strategies and ensure that your business is building lasting relationships, rather than constantly replacing lost customers.
The Role of Predictive Analytics in Customer Retention
Predictive analytics gives businesses the ability to anticipate customer behavior instead of reacting after churn happens. Companies can identify early warning signs of customer dissatisfaction and take timely action to retain them by analyzing historical data and applying machine learning.
The process involves studying data points such as product usage, purchase history, support tickets, payment activity, and survey feedback. Small shifts, such as a drop in logins, repeated complaints, or unusual buying patterns, often signal that a customer may be on the verge of leaving.
Predictive models flag these risks by assigning churn probability scores, allowing businesses to group customers as loyal, at risk, or likely to churn.
With this visibility, retention strategies become more targeted and effective. A customer flagged as at risk might receive a special discount, a personalized demo of unused features, or proactive support to resolve frustrations.
Predictive analytics also identifies the best times to engage, ensuring outreach feels timely and relevant rather than disruptive.
Beyond reducing churn, these insights strengthen long-term loyalty. Continuous learning from behavior trends helps businesses improve product features, refine communication, and deliver services that adapt to evolving customer needs.
5 Best Practices for Implementing Customer Retention Analytics
Customer retention analytics only delivers value if you know how to put it into practice. Here are five best practices to guide you:
Collect data from multiple sources
To get the complete picture of your customers, gather data from support tickets, surveys, product usage, and social media. Each channel reveals different aspects of customer behavior.
When you bring it all together, you can identify recurring issues, discover opportunities for improvement, and develop more accurate retention models.
Define clear retention metrics
Select Key Performance Indicators that align with your goals, such as churn rate, customer lifetime value, or customer satisfaction score. These metrics give you a way to measure progress.
Tracking them consistently helps you identify trends, understand what’s working, and pinpoint areas that need adjustment.
Use predictive analytics models
Rely on machine learning and statistical methods to predict churn and flag at-risk customers. These models examine past behavior, such as lower engagement, complaints, or fewer purchases, and identify warning signs that may indicate future issues. Acting early on these signals allows you to design proactive strategies to retain valuable customers.
Segment customers effectively
Different customers have different needs, so group them based on factors like demographics, engagement, or purchase history. With segmentation, you can personalize retention strategies, such as offering rewards, discounts, or enhanced support. This way, your efforts are more targeted and effective.
Act on insights quickly
Data alone won’t change outcomes unless you act on it. Use what you learn to create campaigns, improve your product, or enhance customer support. Moving quickly shows customers you care about their experience, which strengthens loyalty and reduces churn.
How SentiSum Enhances Customer Retention Analytics
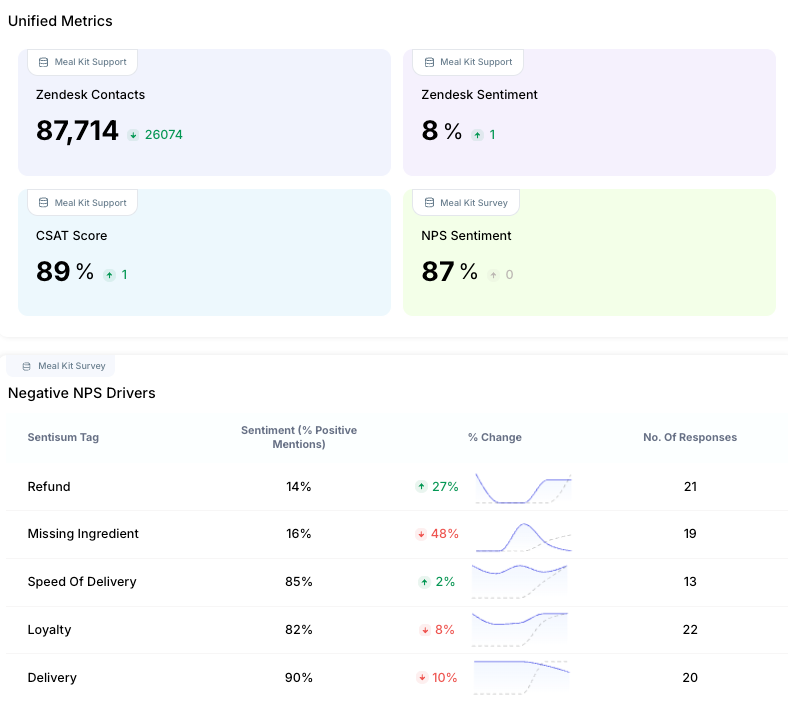
SentiSum enables you to convert customer feedback, including tickets, chats, surveys, and reviews, into real-time insights. Instead of relying on delayed reports, you see churn signals the moment they appear.
Here are the key features that drive retention
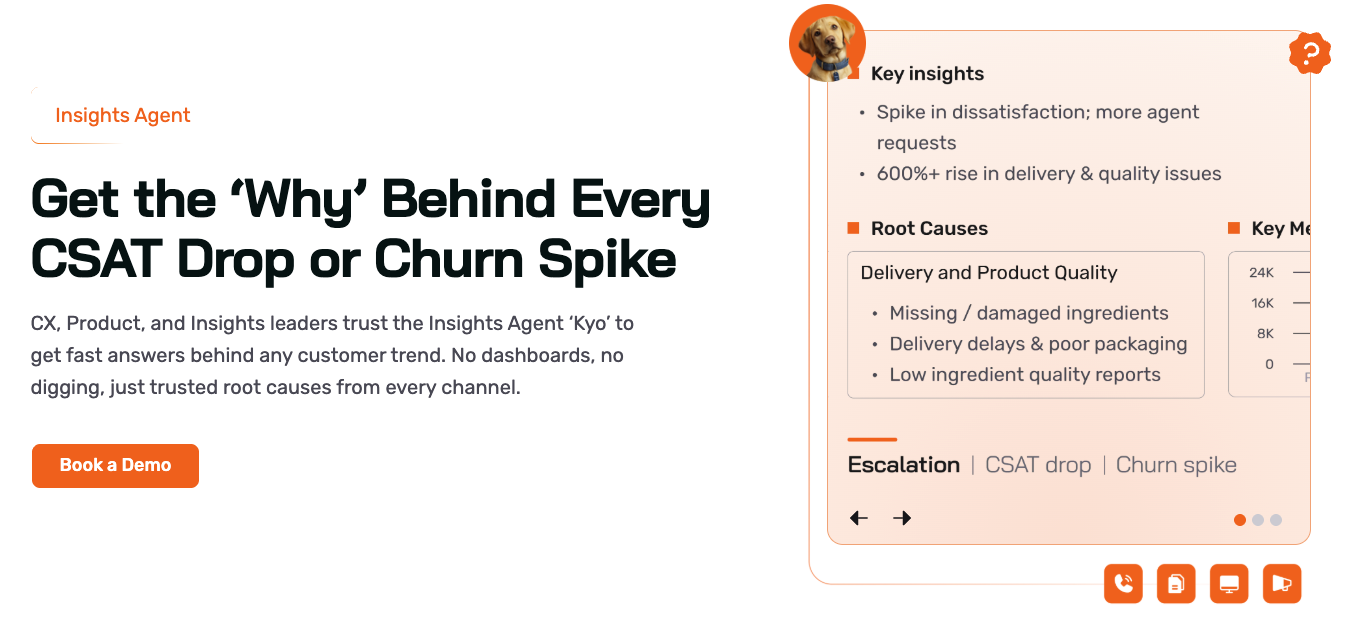
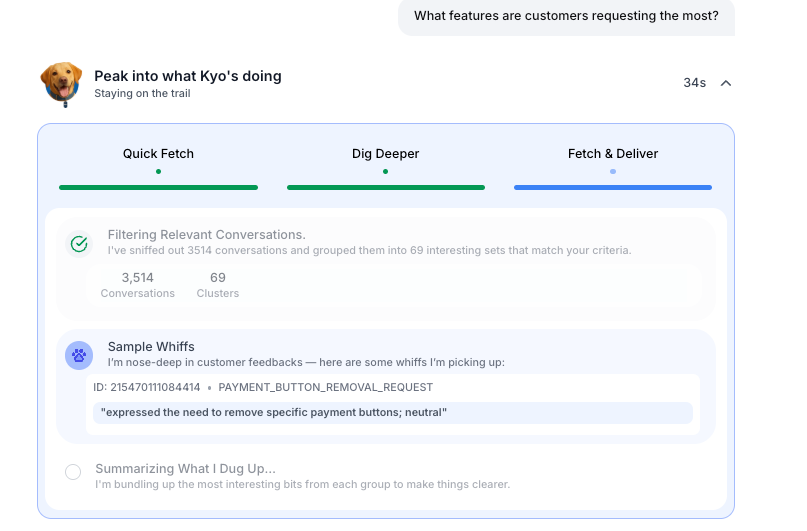
- Kyo, the AI Agent: Kyo works like your 24/7 retention analyst, summarizing trends, identifying risks, and recommending practical next steps. Instead of leaving you with dashboards full of raw data, the AI agent interprets the findings and guides next-best actions that directly impact customer satisfaction and retention.
- Real-Time Feedback Analysis: SentiSum processes support tickets, chats, surveys, and reviews in real-time, providing you with live visibility into customer concerns. This enables you to fix issues as they arise, prevent escalation, and ensure customers feel heard.
- Churn Prediction and Risk Detection: By analyzing behavior, sentiment, and feedback patterns, SentiSum identifies customers most at risk of leaving. These early warnings allow you to engage proactively with tailored offers, support, or solutions that reduce cancellations and improve loyalty.
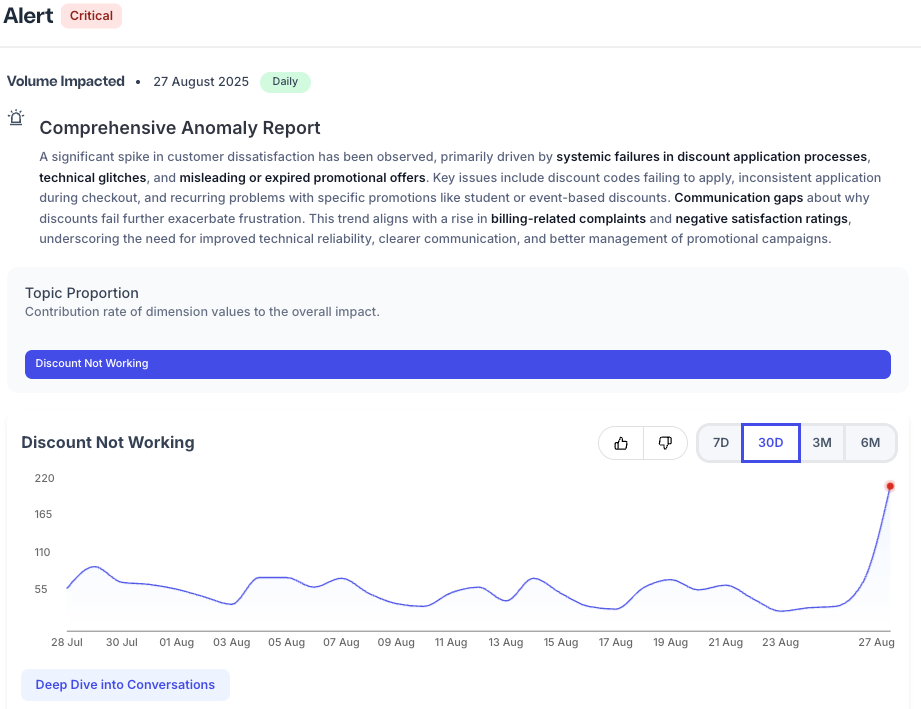
- Anomaly Detection: The platform detects unusual spikes in issues, such as payment failures or login errors, on an hourly or daily basis. Catching these anomalies quickly prevents minor problems from escalating into widespread customer churn triggers, thereby protecting both the customer experience and brand reputation.
- Automated Tagging and Root Cause Analysis: SentiSum automatically categorizes feedback using adaptive AI tagging, which evolves in response to customer language and context. This not only streamlines analysis but also pinpoints root causes behind dissatisfaction, helping teams resolve issues at their source and boost retention outcomes.
Conclusion
Customer retention is more than tracking metrics; you need to understand why customers stay, why they leave, and take timely, informed action.
Businesses can anticipate risks and strengthen customer loyalty by monitoring key metrics such as NPS, CSAT, churn rate, CLV, and retention rate, and leveraging predictive analytics.
SentiSum takes this a step further by transforming customer feedback into actionable insights in real-time, enabling proactive engagement, early detection of churn, and better decision-making.
Book a demo with SentiSum today and see how AI-driven analytics can prevent churn and boost loyalty.
Frequently Asked Questions
Customer retention analytics software collects and analyzes customer data from surveys, support tickets, reviews, and interactions. It identifies patterns, flags risks, and provides actionable insights to prevent churn, improve satisfaction, and strengthen long-term customer loyalty.
Predictive analytics examines customer behavior, purchase history, and engagement trends to anticipate churn. By identifying at-risk customers early, businesses can take proactive steps, such as offering personalized support or incentives, to retain them and boost loyalty.
SentiSum stands out as an AI-native customer retention tool, combining real-time feedback analysis, churn prediction, and anomaly detection. Kyo, SentiSum's AI agent, highlights anomalies, detects churn risks, and suggests next-best actions in real time to prevent churn and improve customer satisfaction.
AI-native tools like SentiSum analyze feedback, detect anomalies, predict churn, and provide actionable recommendations. By transforming raw data into actionable insights, these tools enable timely interventions, personalize customer engagement, and help companies reduce churn while boosting loyalty and increasing lifetime value.
Look for real-time feedback analysis, churn prediction, anomaly detection, AI-driven insights, automated tagging, and root cause analysis. These features help identify risks early, understand customer sentiment, act proactively, and enhance retention strategies effectively.
Explore Real Success Stories
Explore Success Stories
Talk to a Data Expert