.webp)


.webp)
.svg)


TL;DR
- Traditional customer experience dashboards show you what happened last month. High-performing dashboards in 2026 detect churn risks in real time and turn feedback into retention actions.
- When dashboards surface sentiment shifts and contact spikes as they happen, teams stop reactive firefighting and protect revenue.
- AI-native platforms eliminate manual analysis work. AI agents automatically detect anomalies, explain root causes, and deliver alerts into your workflow.
- Cross-functional teams align when everyone sees the same early warnings. Product spots feature frustrations, support identifies process friction, and executives track retention from one unified view.
- Subscription businesses prevent churn by connecting metrics to customer conversations. Dashboards that link CLV and churn rate to actual feedback reveal why customers leave, enabling targeted retention before revenue walks.
- Clean design drives faster action. Automated alerts, clear layouts, and drill-downs help teams move from problem to fix in hours instead of weeks.
- Executives gain confidence through predictive insights instead of lagging indicators. Dashboards that flag at-risk segments and recommend actions let leadership allocate resources proactively.
Churn is rarely a surprise if you know where to look. But the problem is that conventional dashboards bury the warning signs in aggregate scores and monthly reports.
By the time your NPS drops or CSAT flags red, customers have already decided to leave. For subscription businesses, this lag between signal and action costs significant revenue.
High-performing customer experience dashboards in 2026 shift from tracking general satisfaction to detecting specific retention risks in real time. They connect quantitative data like churn rate and customer life value (CLV) with the qualitative "why" behind customer behavior, highlighting trending complaints, sentiment shifts, and contact spikes as they happen.
When support teams, insights leaders, and executives see the same early warnings, they can intervene before cancellations accelerate. This article explores how to build a customer experience dashboard that defends your bottom line.
What Should Your Customer Experience Dashboard Include?
Your customer experience dashboard should combine numbers, insights, and actionable analytics to help you make decisions and improve operations.
Here’s a detailed look at what your dashboard should cover:
1. Core Customer Experience Metrics
These key metrics give you a snapshot of how well your brand meets customer expectations and builds loyalty. They help you spot areas that need improvement and measure overall customer health.
- Customer Satisfaction Score (CSAT): See how happy your customers are with a specific interaction, product, or service. Post-interaction surveys show where you’re doing well and where you’re causing frustration. High scores mean you’re aligned with customer expectations; low scores highlight friction points to fix.

- Net Promoter Score (NPS): Measure loyalty by asking how likely customers are to recommend you. Knowing who your promoters, passives, and detractors are helps you understand brand perception, advocacy potential, and revenue opportunities. Watching NPS trends over time shows whether your CX efforts are paying off.
- Customer Effort Score (CES): Track how much effort your customers put in to complete tasks like purchases or support requests. Lower effort leads to higher satisfaction and retention. Pinpoint high-effort areas so you can simplify processes and reduce frustration.
- Churn Rate: Track the percentage of customers who leave over a set period. This helps you assess retention strategies, find the root causes of dissatisfaction, and anticipate revenue impact.
- Customer Lifetime Value (CLV): Estimate the total revenue each customer brings over their relationship with you. Use this to guide investments in loyalty programs, marketing, and retention campaigns.
2. Customer Journey and Touchpoint Metrics
Mapping your customer journey helps you see where customers succeed and where they struggle.
- Journey Mapping Data: Visualize the journey from awareness to purchase and beyond. Identify drop-offs, delays, and friction points to improve processes and personalize experiences.
- Touchpoint Performance Metrics: Check each interaction on your website, mobile app, support channels, social media, and in-store experiences. Track response times, engagement, conversions, and resolution efficiency.

- Conversion Rates by Stage: Monitor the percentage of customers who move through the awareness, consideration, and purchase stages. Spot bottlenecks and optimize the journey.
3. Engagement and Interaction Metrics
Understand how customers engage with you and find opportunities to add value.
- Website and App Analytics: Track page views, session duration, bounce rates, and feature usage. Find what drives engagement and what frustrates users.
- Email and Campaign Metrics: Measure open rates, clicks, and responses to see how well your communication efforts perform.
- Social Media Sentiment: Monitor mentions, comments, and shares to understand perception and engagement. Social listening helps you act on negative trends or capitalize on positive feedback.
- Support Ticket Trends: Analyze volume, request types, and resolution times. Identify recurring problems and proactively improve self-service options or products.
4. Qualitative Feedback
Numbers only tell part of the story. Add context and uncover hidden pain points with qualitative insights.
- Survey Comments and Reviews: Open-ended feedback reveals frustrations, patterns, and what customers value most.
- Customer Interviews and Focus Groups: Direct conversations help you understand emotions, motivations, and expectations that surveys might miss.
- Sentiment Analysis: AI-driven tools can process feedback across channels to show trends and flag hidden issues.
5. Operational and Team Performance Metrics
Your CX depends on your teams. Track performance to ensure consistent, high-quality experiences.
- Response and Resolution Times: See how quickly teams respond and resolve issues. Fast resolution boosts satisfaction and trust.
- First Contact Resolution Rate: The percentage of issues resolved on the first attempt. Higher rates reduce customer effort and improve loyalty.
- Employee Engagement Metrics: Engaged employees deliver better service. Track satisfaction, training completion, and team performance to improve CX.
6. Predictive and Advanced Analytics
Look ahead by using historical data to anticipate customer behavior.
- Customer Segmentation Analysis: Group customers by demographics, behaviors, or purchase history for personalized experiences and targeted retention.
- Churn Prediction Models: Identify customers at risk of leaving and act early to prevent churn.
- Experience Drivers: Pinpoint what most influences satisfaction, loyalty, and repeat purchases so that you can prioritize improvements.
7. Visualization and Reporting
How you present data matters.
- Customizable Dashboards: Focus on the metrics that matter most to your team, marketing, CX, or operations for faster insights.
- Trends and Comparative Analysis: Track changes over time, compare periods, and benchmark against industry standards.
- Alerts and Notifications: Get real-time alerts for spikes in complaints, issues, or negative sentiment so you can respond quickly.
8. Integration Capabilities
Bring all your data together for a full picture.
- CRM Systems: Connect customer profiles, interaction history, and purchase records.
- Marketing Platforms: Pull in campaign metrics, engagement data, and web analytics.
- Support Platforms: Include ticketing, chat, and call center data for insights on resolution and satisfaction.
- E-commerce and Product Systems: Add order histories, product usage patterns, and feedback to understand buying behavior and product performance.
Best Practices for an Effective Customer Experience Dashboard
Here are key practices to make sure your customer experience dashboard delivers real value:
1. Make Data Actionable
Highlight trends, unusual patterns, or drops in metrics with clear indicators, such as colors or alerts.
For example, if your Net Promoter Score (NPS) falls below a predefined threshold, the dashboard should automatically notify the CX team.
Include context, such as past performance or comparisons to goals, so teams understand why changes are happening. The aim is to help users quickly move from noticing a problem to taking action.
2. Keep It Clear and Easy to Use
Focus on key metrics like CSAT, NPS, CES, and churn, and avoid overcrowding the screen. Use a clean layout, clear fonts, balanced spacing, and logical order. Highlight important metrics with contrasting colors or icons.
Features like filters or drill-downs let users explore details without cluttering the main view. The goal is for all executives, managers, and support agents to quickly understand insights.
3. Pull in Real-Time Data from Multiple Sources
Customers interact with your brand in many ways, so your dashboard should combine data from all systems: CRM, support tools, social media, surveys, and more. Automate data collection to reduce errors and keep information up to date.
Real-time updates help teams spot issues quickly, such as spikes in complaints or delays in response. Combine numbers (like churn or NPS) with customer comments or chat logs to get a complete picture of sentiment. This gives a single, accurate view of the customer experience.
4. Focus on Retention and Proactive Improvements
Track retention metrics like Customer Lifetime Value (CLV), repeat purchases, and engagement alongside satisfaction scores. Watch for early warning signs, like reduced product usage or slower responses, and address them before they become problems.
Using predictive analytics can help identify at-risk customers so teams can take targeted action, like personalized support or loyalty campaigns. By focusing on retention and proactive improvements, your dashboard becomes a tool to strengthen long-term customer relationships.
How SentiSum Enhances CX Dashboard Design
Most customer experience dashboards rely on manual analysis and monthly reports. However, SentiSum's AI-native platform automates early warnings and delivers churn insights in real time.
Real-Time Churn Detection and Alerts
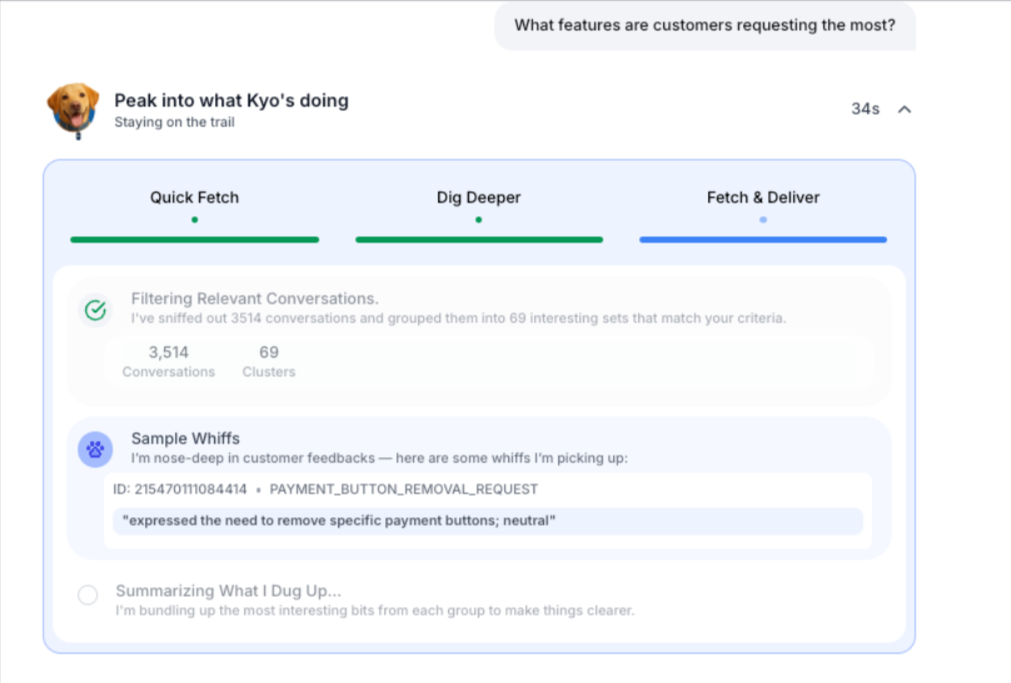
Kyo, SentiSum's AI agent, highlights anomalies, detects churn risks, and suggests next-best actions in real time across support tickets, chats, calls, emails, and CRM notes. When sentiment dips, contact topics shift, or urgency spikes, teams get early-warning alerts before CSAT or NPS drops.
Rather than waiting for CSAT or NPS to drop, teams get early-warning alerts, giving them a chance to intervene before customers start walking away.
Built for Cross-Functional Teams
SentiSum breaks down silos by unifying every customer voice, support, product, marketing, and leadership into a single central source of truth.
Through Kyo, teams can ask natural-language questions (e.g., “Why is CSAT falling in region X?”) and immediately surface root causes, trends, and recommended actions, without relying on analysts.
Best of all, these insights are accessible from where teams already work, including Slack, Teams, Zendesk, etc.
As everyone sees the same insights, whether it’s recurring ticket issues in support, bug reports for product, or customer conflicts for marketing teams, they can align on priorities and track progress together.
From Reactive Reports to Proactive Insights
Traditional VoC setups lean on monthly dashboards and lagging KPIs. SentiSum's AI-native platform flips that model:
- With the Early Warning Agent, powered by Kyo, teams get baselines for sentiment, volume, and topics, spot shifts in real time, and deliver context-rich alerts directly into workflows. Sentisum doesn’t just tell you something changed; it explains why, and suggests what to fix.
- Meanwhile, the Insights Agent helps teams go deeper: you ask, “What caused the latest spike in complaints?” and Kyo shows you trend data, root causes, and sample feedback all backed by real conversations.
Over time, this turns your CX dashboard from a passive reporting tool into an active system for spotting risk, prioritizing fixes, and preventing churn.
Turn Your Customer Experience Dashboard Into a System That Drives Action
A strong CX dashboard gives you a clear view of satisfaction, loyalty, effort, churn signals, and the feedback behind those numbers.
When teams can see issues early and understand what’s causing them, they can fix problems faster and improve journeys before customers get frustrated.
SentiSum elevates this even further. Its AI gives you real-time insight into what’s changing, why it’s happening, and what to do next. With live alerts and churn predictions built into your workflow, your team can act quickly rather than wait for monthly reports.
If you’re ready to lift your customer experience with faster insights and smarter decisions, book a demo with SentiSum today.
Frequently Asked Questions
A customer experience dashboard should combine key metrics like CSAT, NPS, CES, churn, and CLV with journey analytics, engagement metrics, qualitative feedback, team performance data, and predictive insights. Include visualizations, real-time updates, and integration with CRM, marketing, support, and product systems to enable actionable decisions and improve customer satisfaction.
Effective customer experience dashboards provide a single view of metrics, trends, and insights. Examples include dashboards that track CSAT, NPS, CES, churn, and CLV alongside journey mapping, touchpoint performance, engagement metrics, and qualitative feedback.
Tools like SentiSum enhance dashboards with AI-driven insights, alerts, and churn predictions for proactive customer management.
Design a CX dashboard that is clear, actionable, and user-friendly. Focus on key metrics, use simple layouts, colors, and icons, provide drill-downs, integrate data from multiple sources, and update in real time. Highlight trends and anomalies, link metrics to actions, and emphasize retention and proactive improvements to boost customer loyalty.
Key CX metrics include Customer Satisfaction Score (CSAT), Net Promoter Score (NPS), Customer Effort Score (CES), churn rate, and Customer Lifetime Value (CLV). Complement these with journey mapping, touchpoint performance, engagement analytics, social sentiment, support ticket trends, and employee performance to get a full picture of customer experience and retention.
AI enhances CX dashboards by analyzing feedback from multiple channels to detect sentiment, trends, and root causes. It predicts churn, identifies urgent issues, and recommends actions.
AI enables real-time alerts, deeper insights, and proactive interventions, transforming dashboards from static reports into dynamic tools that help teams improve satisfaction and loyalty.
Explore Real Success Stories
Explore Success Stories
Talk to a Data Expert