.webp)



.webp)
.svg)


TL;DR
- CSAT is an average built from the 5 to 15% who answer, so it hides the silent majority who actually decide your revenue.
- The real story sits in your customer conversations: tickets, chats, reviews, and calls that name what broke in the customer's own words.
- Read every conversation, group by root cause instead of symptom, fix the cause, and the score follows on its own.
You open your dashboard. CSAT is up. NPS holds steady. Reviews look fine.
Then you look at the rest of the business. Refunds are climbing. Repeat buyers are slipping away. The support queue is full of tickets that all say the same thing.
The scores tell you one story. The business tells you another. Both are true at the same time. That gap is the problem. CSAT is the reason you cannot see it.
CSAT is not wrong. It is misleading. There is a difference, and it costs retail CX teams real money in 2026.
Why CSAT is misleading
A 4.6 CSAT is an average. Averages bury people. The ones who never replied. The ones who left without a word. The ones who wrote a one-star review two weeks later and never came back.
Three things break CSAT from the inside.
Start with who answers. In retail, survey response rates sit between 5% and 15% on a good day. The people who fill in the form already love you or already hate you. The 85% in the middle stay quiet. That quiet middle is the loyalty you are fighting for. CSAT never hears them.
Then there is timing. A customer rates one moment, not the next month. The warehouse that ships late today shows up in your score weeks later. By then the orders are already gone.
And the question itself does damage. "How satisfied were you?" gives you a feeling. It never tells you what broke. You end up holding a temperature with no idea where the fire is.
So you fix things for the customers who shout. The quiet majority who decide your revenue tell the survey nothing.
The data CSAT cannot see
Every retailer owns one data source that never lies. Customer conversations. Tickets, chats, emails, reviews, calls, social DMs. It refreshes by the hour.
A customer who messages support is not making small talk. They are telling you what broke. In their own words. With a timestamp. With an order number. With the product they bought and the policy that failed them.
Most retailers waste this. They tag tickets by hand. They read a few hundred a quarter. They report the top three contact reasons and call it insight. Meanwhile the real story sits inside 40,000 conversations nobody opens.
Five things your conversations know that CSAT never will
Read every conversation instead of a sample, and the patterns show up fast.
A third of your subscription cancellations trace to one payment retry. It fails on certain card types. Your churn rate cannot show you that. The words customers use when they cancel can.
Refund rejections pile up because a return window built for apparel punishes the customer buying supplements. Same policy. Wrong aisle.
Delivery complaints triple in 72 hours. They all point to one warehouse. CSAT has not moved yet. By the time it does, the orders are late and the reviews are written.
Your support bot resolves 80% of queries. The headline looks healthy. It also fails 37% of billing queries that need an account change. Those customers wait, escalate, and leave. The 80% hides the 37%.
Refund questions jump 180% in a day after a pricing change goes live. Your pricing team had no idea. The conversations did.
None of this shows up in a satisfaction score. All of it shows up in what customers said.
How to read conversations instead of scoring them
Reading every conversation by hand is impossible. That is why teams sample. And sampling is how the root cause slips through.
Two changes fix this.
First, stop tagging tickets by category alone. One root cause hides across many categories. A renewal bug shows up as a billing ticket, a refund request, a cancellation, and an angry review. Tagged apart, it looks like four small problems. Read together, it is one big one.
Second, group by root cause instead of symptom. Count how often each cause appears. Then put a number on it. How many refunds. How much wait time. How many lost renewals. That number is what gets the fix funded.
Third, send the number to the team that owns the fix. A renewal bug belongs with product, not support. A late-shipping warehouse belongs with operations. CSAT lands on the CX team and stops there. A root cause with a price tag travels to the people who can actually solve it. That is the difference between a report nobody acts on and a fix that ships.
This is the work conversation analytics does at scale. It reads 100% of your conversations, not a sample. It clusters them by root cause, not by tag. And it shows you the operational issue underneath, with the customer's own words attached.
What one wellness brand found when it looked
A fast-growing wellness retailer had everything you want on a dashboard. Strong brand. Loyal buyers. Healthy scores.
Then the team read its full set of conversations instead of a quarterly sample. The story changed. Returns were not a product quality problem, which everyone had assumed. They traced back to a cancellation flow that confused customers at renewal. The same root cause was scattered across five ticket categories. Apart, they looked like five problems. Together, they were one.
One fix closed all five.
A gaming brand learned the same lesson on a very different business. Different products. Different patterns. Same root. You can read both stories in our customer case studies.
The teams did not work harder. They stopped guessing how customers felt and started reading what customers wrote.
What changes when you fix the root cause
Find the cause, fix it, and the score follows on its own.
Refunds fall because the policy that triggered them is gone. Repeat purchase climbs because the renewal flow stops confusing people. Cost to serve drops because the same ticket stops coming back. CSAT goes up too, quietly, because you fixed the thing it was hiding.
That is the order that works. Cause first. Fix second. Score last.
Stop scoring. Start reading.
CSAT is misleading because it grades a feeling and hides the cause. Your conversations do the opposite. They name the cause in the customer's own words, with the receipts attached.
So if your scores look healthy while your business does not, trust the gap. Then go upstream. Read every conversation. Find the operational issue buried inside. Fix the root cause.
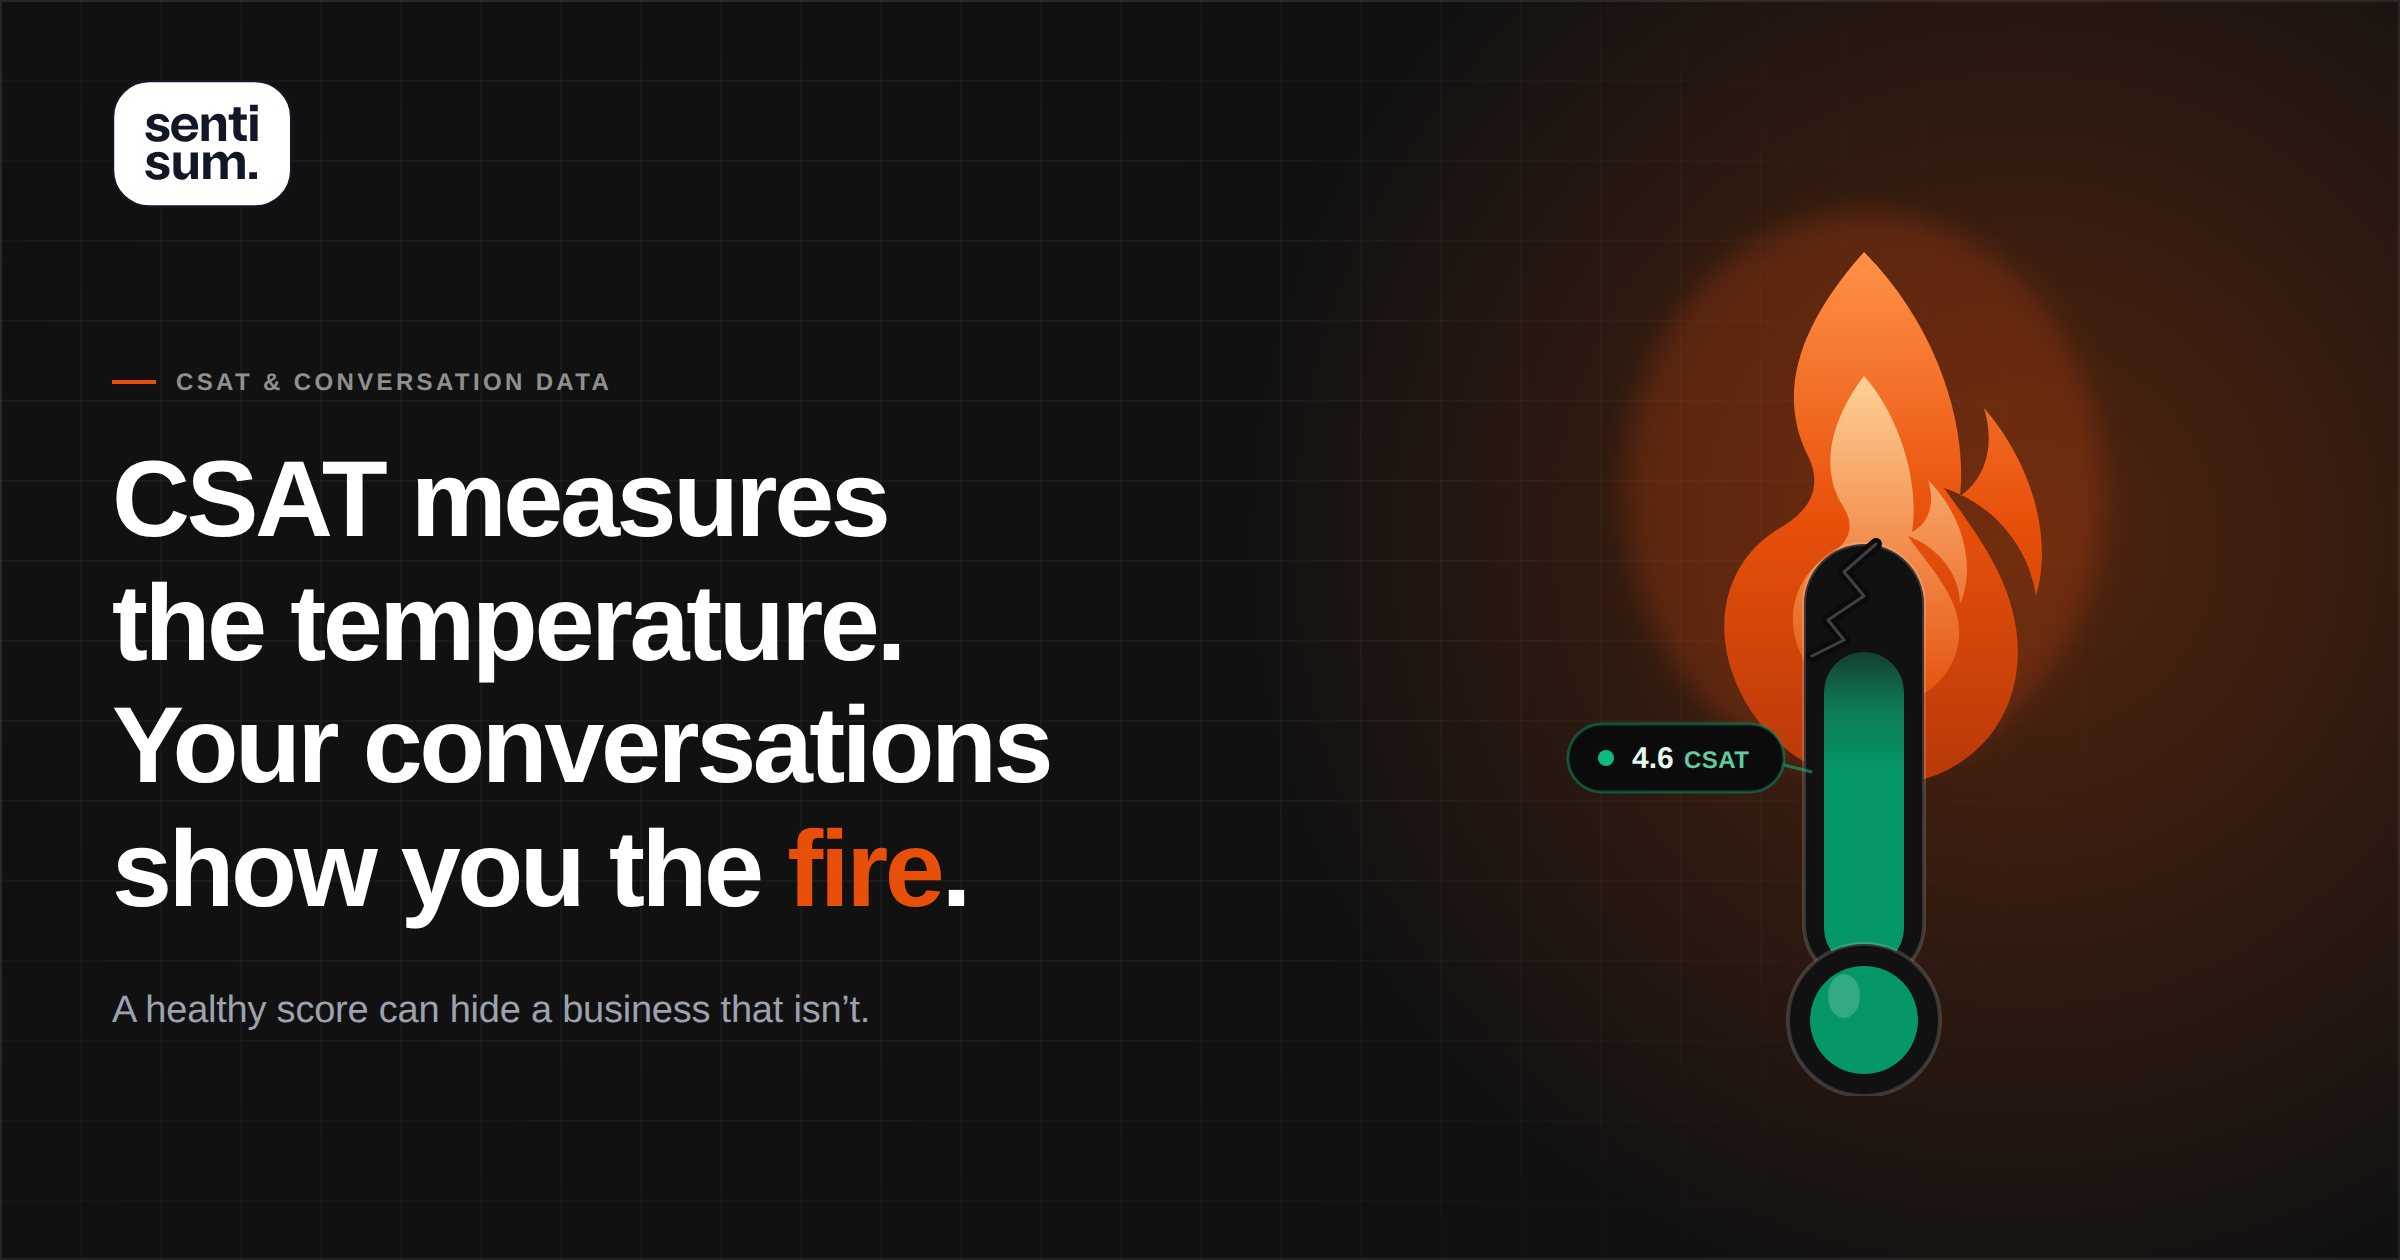
CSAT measures the temperature. Your conversations show you the fire.
See what your conversations are telling you.
Frequently Asked Questions
CSAT is fine for spotting a trend, but on its own it is misleading. It averages the small group who answer the survey, and most of them already love you or already hate you. It gives you a feeling, not a cause. Treat it as a thermometer, then read your conversations to find what actually broke.
Because CSAT only hears the people who reply. In retail that is 5 to 15% of customers, and they are the loudest ones. The quiet majority churn without filling in a form. Their reasons sit in cancellation messages, refund requests, and reviews, not in your score.
Both measure how customers feel. Neither tells you why. NPS asks if they would recommend you. CSAT asks if they were satisfied. They work as trend lines, but the answer to "why" lives in what customers actually wrote, not in either number.
Do not throw CSAT out. Add the layer underneath it. Measure how often each root cause shows up in your conversations, and what it costs you in refunds, wait time, and lost renewals. A cause with a price tag gets fixed. A score on its own does not.
It is the practice of reading 100% of your customer conversations and grouping them by root cause instead of ticket tag. It surfaces the operational issue behind your complaints, with the customer's own words attached. That is how you find the problem CSAT is hiding.
Explore Real Success Stories

Explore Success Stories


Talk to a Data Expert