.webp)



.webp)
.svg)


TL;DR
- Pick a software that unifies tickets, chats, and feedback, then sizes each root cause and links you to the proof.
- Run a 45 to 60 day pilot with hard targets for accuracy, alert speed, and tickets you can deflect.
- Choose by use case first, vendor second. A survey suite and an AI-native platform solve different problems.
- Send anomalies into Slack, Jira, or your CRM. Skip the dashboard babysitting and track time-to-fix instead.
Your customers are telling you exactly what is broken. Right now, in tickets, chats, reviews, and survey replies. The hard part is reading it fast enough to act before they cancel.
Most CX teams are still playing catch-up. Forrester's 2026 CX Index shows the private sector improving for the first time in four years, but the gains are uneven: elite brands are pulling further ahead while most others post only incremental change. Your edge in 2026 is speed: how fast you spot an issue, size what it costs, and route the fix to the person who owns it.
This guide shows you how to buy software that does exactly that.
What customer experience analytics software actually does
It turns what customers say and do into action you can take today.
The software reads your tickets, chats, emails, reviews, and survey replies. When something breaks from baseline, it flags the anomaly, shows you the exact conversations behind the spike, and sizes what the problem is costing you. Then it points the right owner at the root cause.
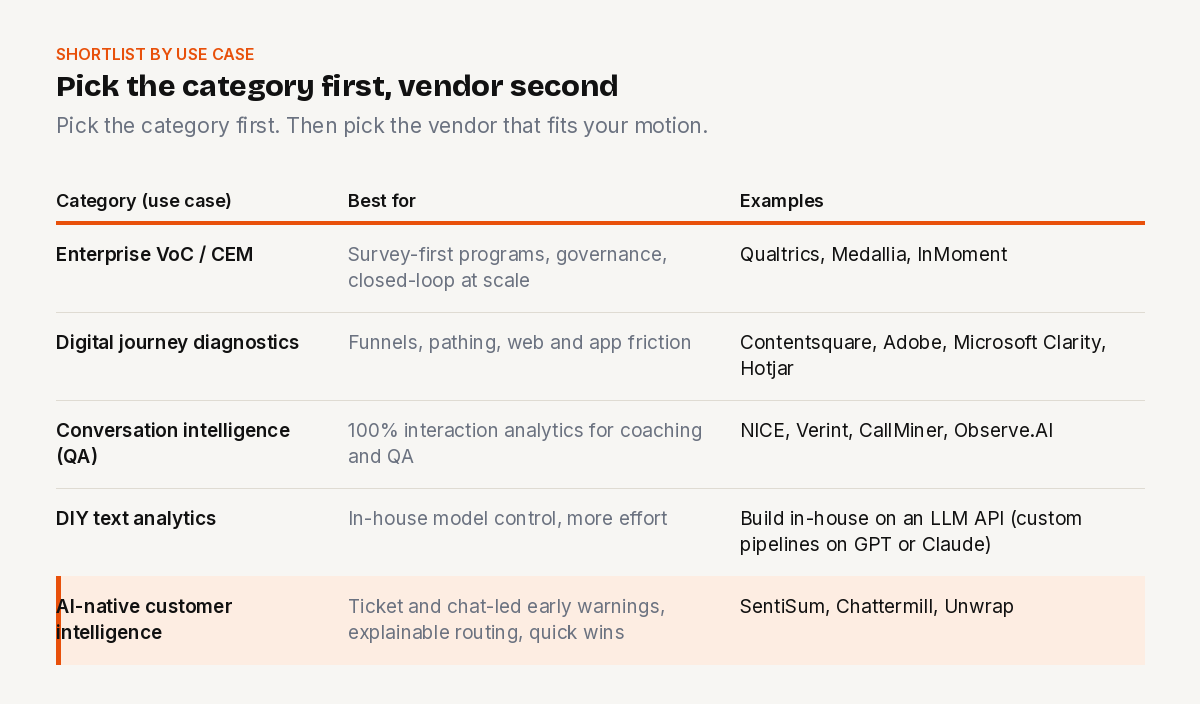
Buying in this category gets confusing because four other categories sit next to it and use similar words. Here is how to tell them apart.
Customer analytics software
This models the lifecycle: CLV, propensity, segmentation, campaign decisions. It won't tell you why yesterday's ticket volume spiked.
Customer experience management (CEM)
This runs your VoC program, with surveys, workflows, dashboards, and governance built in. It's strong for survey-first teams, but you'll still want deeper text analytics to mine what's coming through support.
Journey analytics
Maps digital paths and funnels. Best for UX flow problems, and worth pairing with CX analytics once the language in complaints, like "verification failed," tells you exactly where to look.
Conversation intelligence (contact centre QA)
Scores 100% of interactions for quality and agent coaching. Good for agent behaviour, weaker at sizing root causes across channels unless you pair it with CX analytics.
AI-native customer intelligence
This is the newer tier: it unifies your signals, learns your taxonomy, catches anomalies within minutes, and routes explainable alerts into the tools your team already uses.
What the analysts say, without the noise
Gartner's Magic Quadrant for Voice of the Customer Platforms and Forrester's Customer Feedback Management Wave both keep naming the same three: Qualtrics, Medallia, InMoment. Read those reports for what they are. Proof that the survey-first category is mature. Treat them as one input, then prove fit with your own pilot data.
How to choose CX analytics software
Gartner reports that 91% of service leaders are under executive pressure to roll out AI in 2026. That means your choice has to deliver a measurable win inside a quarter. So judge every vendor against clear bars for accuracy, latency, and routing.
1. Omnichannel text analytics you can verify Pick a tool that reads tickets, chats, emails, reviews, and survey text, with a confidence score and a link to the conversation behind every tag. Aim for precision of 85% or higher on your top 20 themes within the first two weeks of your pilot. If a claim has no clickable proof, your team cannot act on it at speed.
2. Automated taxonomy with drift monitoring The system should discover new themes on its own, learn your taxonomy with a human in the loop, and tell you when the language shifts. Ask for a monthly change log and version history so owners trust what they see.
3. Real-time anomaly detection and routing Alerts should fire within minutes when a topic breaks baseline. Insist on clear ownership. Route each alert into Slack, Jira, or your CRM with what changed, the top drivers, and links to examples.
4. Integrations and historical backfill Connect your helpdesk, CRM, and survey tools with little admin. Backfill 6 to 12 months so you can show finance and product a real before-and-after.
5. Governance that scales Look for SSO, RBAC, audit logs, in-platform redaction, and data residency controls. Get the SOC 2 or ISO docs and DPAs signed before the pilot starts.
6. Multilingual quality on your real channels Do not trust English-only benchmarks. Check precision and recall in the languages and channels where your customers actually complain.
Shortlist by use case
Where SentiSum fits
If your pain is rising repeat contacts and cancellations, you need early warnings that come with evidence and an owner.
SentiSum's Early Warning Agent flags anomalies against baseline in minutes and posts them into Slack with the exact tickets behind the spike. The Insights Agent sizes the problem down to the detail that matters, like "Apple Pay failing on iOS 17," assigns the owner, and tracks the fix in Jira. So your next exec readout shows what changed and why.
Case Study: How JustPark caught a revenue leak hiding in five inboxes
JustPark connects 14 million drivers to parking spaces across the UK and North America. Plenty of feedback. The trouble was where it lived.
Tickets in one system. App reviews in another. Email, surveys, and social each somewhere else. Five or six silos. A problem would start small on a Monday and grow all week, hitting more drivers through more channels, while nobody could see the shape of it. By the time someone joined the dots by hand, hundreds of journeys were already burned.
Steven Burt, Senior Director of Global Customer Experience at JustPark, brought in SentiSum to pull every channel into one view.
Patterns that used to take weeks showed up in days. One jumped out fast. Dozens of drivers a day were hitting barrier problems, all at car parks run by a single partner. Barrier complaints are normal in parking, so this used to vanish into the noise. SentiSum clustered the conversations and showed one systematic issue behind them.
Then it found the cause. Drivers were turning up in a different car than the one they registered. A borrowed car, the family SUV instead of the sedan. The app had no easy way to update a number plate, so the barrier could not validate them and stayed shut. Angry drivers, support tickets across every channel, a strained partner relationship, and revenue walking to competitors.
The fix was small. Let drivers change their plates in the app.
"It would have saved us thousands in revenue," Steven says.
(Read the full JustPark story)
Prove value fast: a 45 to 60 day pilot
McKinsey reports that advanced analytics can cut average handle time by up to 40% and lift self-service containment by 5 to 20%. So your pilot should set explicit targets for handle time and containment, and a clear way to measure both.
Week 0, scope and access. Name owners in Support Ops, Product, and Security. Connect tickets, chats, and recent CSAT or NPS replies. Lock your success metrics and baselines.
Week 1, backfill and baselines. Load 6 to 12 months. Check the top themes match reality. Add 10 to 20 tags you actually care about, like checkout, onboarding, fulfilment.
Week 2, accuracy and explainability. Sample 300 items across your top intents and languages. Measure precision and recall. Every alert must link to the conversations behind it.
Week 3, alerting and routing. Set the thresholds. For example, alert when "verification failed" doubles against the 14-day baseline. Route to Slack, Jira, or your CRM with an owner and an ETA.
Weeks 4 to 5, action and measurement. Open Jira issues for the top three root causes. Track the fixes and the change in repeat contacts.
Week 6, readout and decision. Show accuracy, alert latency, deflection found, tagging time saved, and handle-time movement where it applies.
How to check accuracy, and keep it high
Build a ground-truth set. Randomly sample 300 to 500 items across your top intents and languages. Have two reviewers label them and write down where they disagree. That gives you a clean yardstick.
Measure precision and recall by theme. Report both. Precision shows how clean the results are. Recall shows what the model misses. Tighten your tag definitions, give better examples, then retest.
Watch for drift. Language shifts after a product release or a policy change. Review monthly, update the mappings, and log every change where owners can see it.
Demand explainability. Every insight should carry the conversations that prove it. If a stakeholder cannot click through to the evidence, they will not act.
Security, governance, and languages
Confirm SSO, RBAC, audit logs, in-platform redaction, and your data retention and residency rules up front. Get the SOC 2 or ISO docs and DPAs signed before the pilot. Then check performance in your real languages, not just English, and agree on an escalation path for the edge cases.
From signals to action: the operating cadence
Daily. Anomaly alerts land in Slack. Owners add an owner and an ETA and link the fix.
Weekly. CX, Support Ops, and Product review the trends, commit to the top three fixes, and publish a one-pager. What changed, what we did, what moved.
Monthly. Review the taxonomy and drift. Run an engineering shiproom to kill the systemic drivers.
Quarterly. Exec readout that ties the fixes to deflection, fewer repeat contacts, and lower cost per contact.
The bottom line
Buy software that turns signals into fixes, fast.
Every vendor in this category will show you a dashboard. Fewer will show you the exact ticket behind an anomaly, size what it's costing you, and hand the fix to someone with a deadline. That gap is the whole evaluation.
Run the pilot. Hold it to the 45 to 60 day mark. If it can't find its own JustPark story in your data within that window, it's not ready for your business.
Do that, and repeat contacts fall while cancellations stop compounding. That's the job.
Book a demo: a 30-minute walkthrough | See more customer stories
Frequently Asked Questions
Gartner's Magic Quadrant for Voice of the Customer Platforms and Forrester's Customer Feedback Management Wave both cover enterprise VoC suites like Qualtrics, Medallia, and InMoment. AI-native tools that work off tickets and chats are a newer tier and often sit outside those reports. Read analyst recognition as proof the category is mature, then prove fit with your own data in a 45 to 60 day pilot.
When you are survey-first and need governance and closed-loop workflows at scale. Pair them with an AI-native tool if most of your real signal comes from support tickets and chats.
CX analytics works off interaction data to surface root causes and actions now. Customer analytics models the wider lifecycle. CLV, propensity, segmentation, journeys.
Build a labelled ground-truth set, measure precision and recall by theme and language, demand clickable evidence for every claim, and review drift monthly.
Expect a mix of seats and volume or event tiers. Budget for historical backfill, multilingual models, and alerting. Then weigh that against the savings from deflection and faster handle times.
Explore Real Success Stories

Explore Success Stories


Talk to a Data Expert