.webp)


.webp)
.svg)


TL;DR
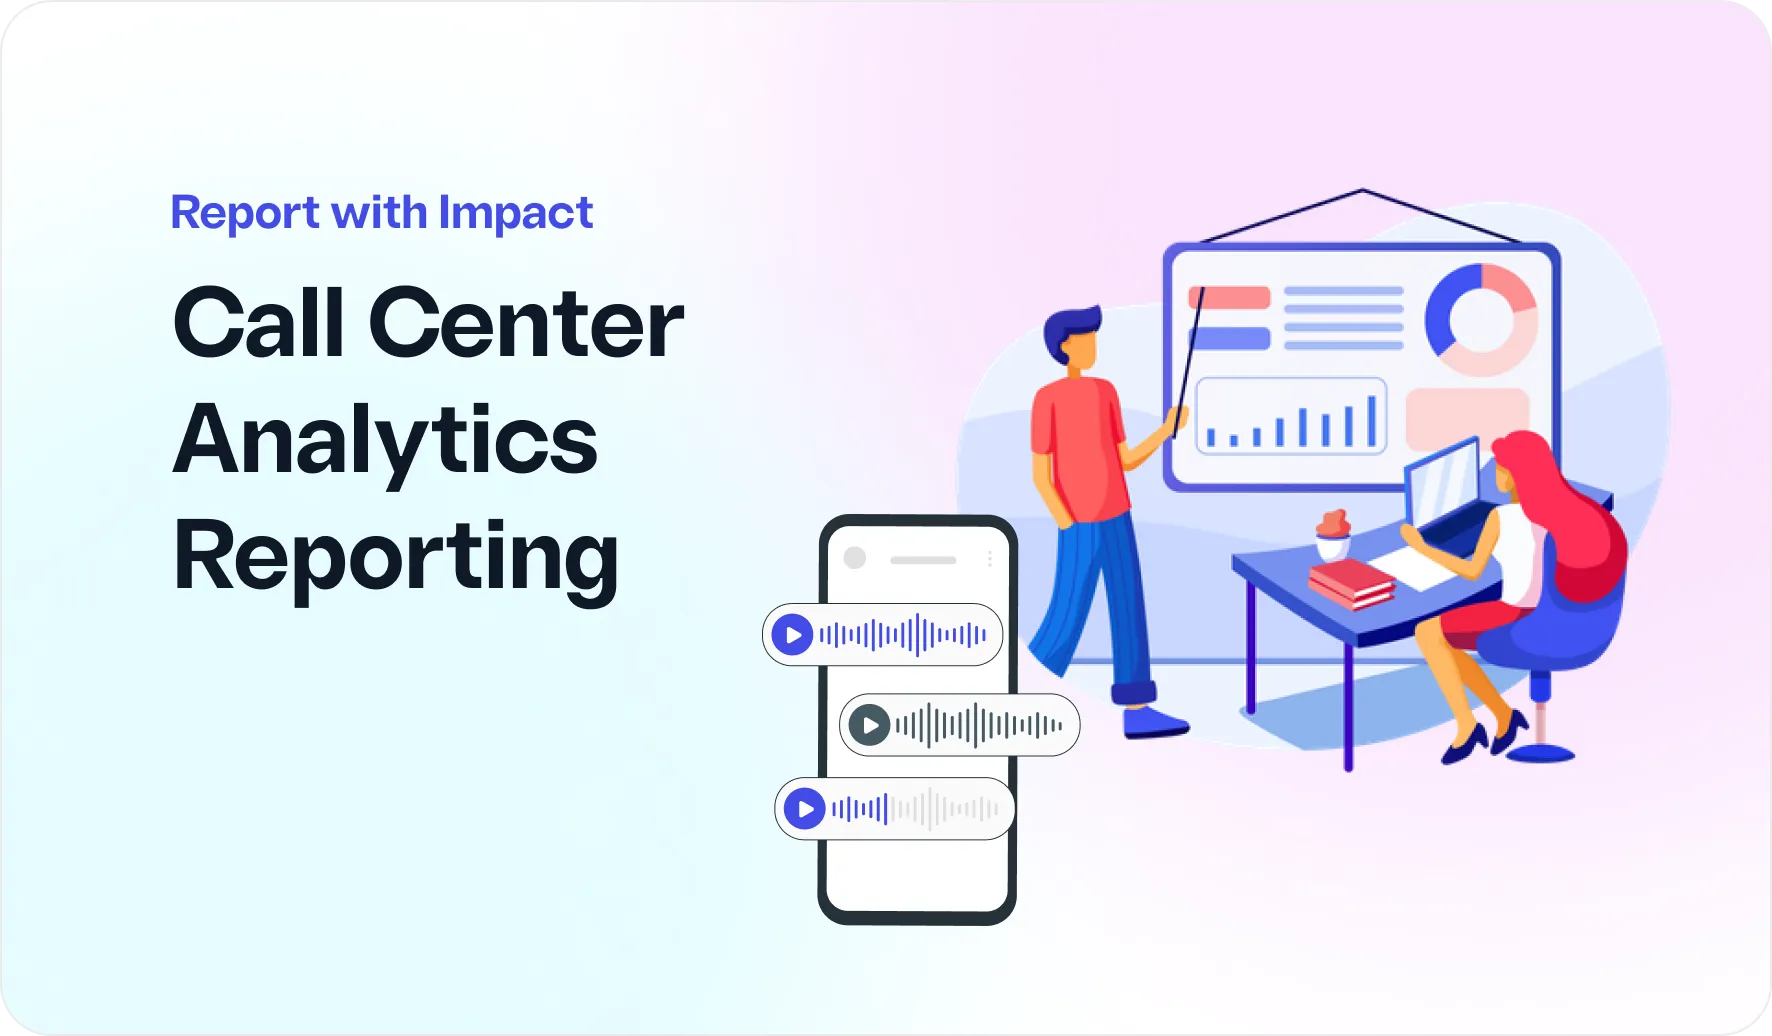
What's the difference between call center insights that gather dust and those that drive real improvements?
Effective reporting.
It's not enough to just analyze data; you need to report it in a way that's clear and impactful so everyone in the organization can understand and act on it.
When insights are well-reported and implemented, you get:
- Improved customer experience (and improved experience metrics like CSAT and NPS)
- Reduced churn
- Higher revenue and profitability
But how do you report effectively? Which metrics should you focus on? What kind of graphs and charts will make your data resonate?
We’ve got you covered.
In this guide, we’ll walk you through the top eight customer experience metrics to track and report on for your team, department heads, and company leaders.
We'll dive into how to report them effectively and share best practices to ensure your insights lead to impactful decisions.
Jump to:
- 3 Call Center Analytics Reporting Mistakes & How to Avoid Them
- 8 KPIs to Report On to Improve Customer Experience
3 Key Call Center Analytics Reporting Mistakes & How to Avoid Them
Before we dive into the KPIs, it's important to know what the common mistakes people make when doing call center analytics reporting, and how you can avoid them.
We scoured through the web to find what Customer Service and business leaders say the mistakes are and presented three key insights here:
Only Focusing on Efficiency Metrics
Many CX leaders believe that FCR is the most important metric to track.
While this and other numbers like call volume and agent handle time are certainly useful gauges of agent efficiency, they’re far from the only metrics you should be looking at.
Qualitative insights such as customer sentiment and reasons for contact give you a much more complete picture of why customers are reaching out in the first place and how they feel when they contact you.
How can you get these qualitative insights?
By analyzing your call center conversations and other customer feedback data, such as reviews, chats, emails, social media comments, and surveys.
Leslie Pagel, Chief Customer Officer at Authenticx, says in this CXM piece:
"Unstructured conversations provide meaningful context around customer concerns, preferences and priorities. Historically, this data has been difficult to mine, but advancements in artificial intelligence (AI) now enable a comprehensive, large-scale analysis of conversations."
Reporting on these conversation insights is key to making targeted, data-backed improvements to your products and the overall customer experience.
And it’s easy to uncover and report on them using an AI-powered analytics tool like SentiSum.
SentiSum shows you:
- Top reasons for customer calls
- Customer sentiment
- Top increasing and decreasing call topics
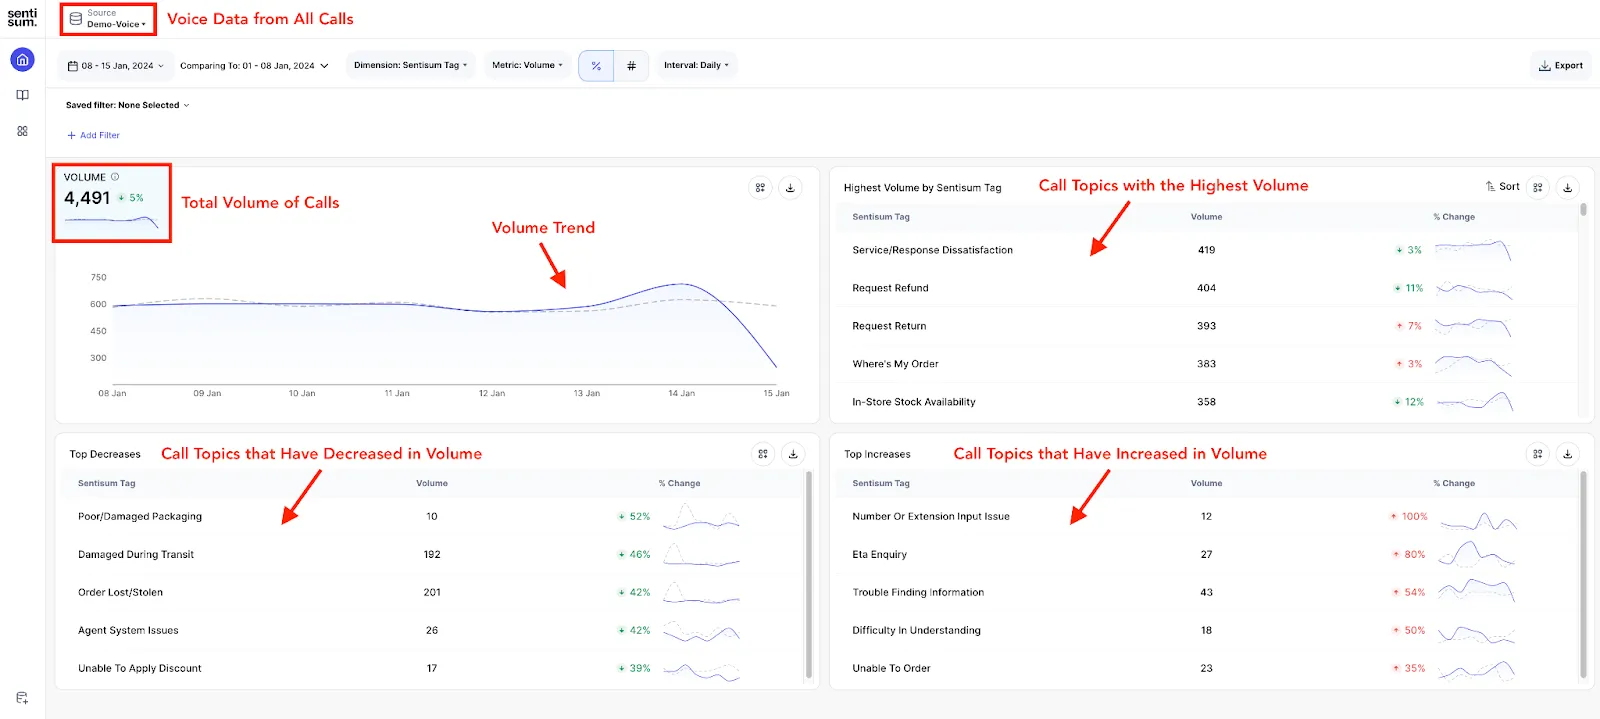
When you have this information, you know exactly what to improve, and which improvements to prioritize first.
“Modern text analytics tools have unlocked the call center in a way we couldn’t have imagined when we started out,” says Sharad Khandelwal, CEO of SentiSum. “The insights we now unearth at scale make it easy for every organization to access customer data and make better decisions with it.”
When the time comes for reporting, you can just add any table you’d like onto your report on SentiSum. The software will automatically populate the data; no manual work needed.

📖 Read more: Customer Conversation Analytics | 6 Use Cases & How It Works
Trying to Gather Data Manually
If you’re not using AI-powered speech analytics software to help you analyze your customer calls, you’re already behind.
Manually listening to and categorizing every support call, then analyzing the data for trends, is time-consuming and often results in outdated insights.
It’s much better to use call center analytics software for ongoing insights into your call data.
Not only will your data and reports always be up to date, but you also get a broader view of your customer journey.
This helps you better understand the root of customer issues and drive meaningful change in areas across the organization.
“AI-powered conversation intelligence can help brands with everything from service and support to sales and retention,” Swapnil Jain, CEO and co-founder of Observe.AI, says in an interview with CMSWire.
“Using advanced interaction analytics, brands can benefit from pinpointing positive and negative CX drivers, advanced tonality-based sentiment and intent analysis and evidence-based agent coaching.”
Making Reports Too Technical
Detailed insights and graphs and charts are great, but beware of overwhelming your audience with too much data and little explanation.
As a Customer Service leader, you might understand all the KPIs and visualizations, but others in the organization, like your CEO or CMO, might not.
Leslie Pagel, Chief Customer Officer at Authenticx, says:
“Rather than relying on a flat presentation of analytics, impactful leaders will embrace the power of storytelling to interpret complex datasets to drive informed decision-making organization-wide."
Be sure to only choose the KPIs that are most relevant and impactful.
And back every data you present with an explanation or a qualitative customer quote to add that human element to raw numbers.
For instance, on SentiSum, you can not only add charts and graphs to your report, you can also add text boxes to explain the data.

To make your life even easier, you can also use Dig In (our ChatGPT-like AI for your call center data) to write out summaries for you.
Incorporate these explanations in your reports so everyone understands the data.

You can also send out short and impactful email digests at regular intervals (daily, weekly, monthly, etc.) to make sure these insights get seen and implemented.
Think of these as “snapshots” of your call center analytics data—showing the most important information to the right people at the right time.

Sharing these insights regularly with the product team was a game changer for Hotjar, a digital experience insights tool.
Nick Moreton, Director of Support at Hotjar, and his team have used SentiSum to uncover important trends about what's driving customers to raise support tickets.
“We are … [using] those insights to inform our conversations with product teams so that we’re influencing our changes and updates based on what the customers are saying,” says Moreton.
Book a demo with SentiSum below and see call center analytics reporting in action.
But, what insights do you report on? We explain them in detail in the next section.
8 Most Important KPIs to Report On to Improve Customer Experience
The main goal of Customer Service leaders is to improve customer experience, which is usually measured by metrics like CSAT, NPS, and FCR.
To improve these metrics and customer experience, you need to go beyond surface-level data, and analyze customer conversations across all channels – phone calls, emails, chats, social media, surveys, and more.
This way you’ll be able to understand the root causes of customer satisfaction or dissatisfaction, and implement changes that directly impact these scores.
Reporting these insights effectively ensures that every department understands the customer journey and works together to enhance the overall experience.
Here are 8 important metrics we recommend you analyze and report on to improve customer experience as a whole:
- Call volume
- Top reasons for contact
- Increases/decreases in contact
- Customer sentiment
- Customer satisfaction score (CSAT)
- Net promoter score (NPS)
- Average handle time (AHT)
- Customer emotions
Let’s look at each in detail, using reporting screenshots from our call center analytics reporting software, SentiSum.
1. Call Volume
Every customer call represents a friction point.
And high call volumes mean there are multiple friction areas that need addressing.
You want to closely track this volume trend so you can identify and reduce these friction points (and call volume) over time.
This KPI also measures the success of past improvement projects—if a specific friction area was resolved, the call volume for that issue should decrease.
For instance, screen recording software Loom was able to reduce its contact rate from 4% to 1% by better understanding its most frequent support ticket issues (all while scaling to 10 million users).
Best Practices:
- Highlight call volume trends over time: Use line graphs to help visualize spikes and drops in call volume so you can pinpoint when and where issues occur.
- Compare volumes against different periods: Comparing month-over-month or year-over-year call volume data lets you identify patterns and measure the impact of changes or improvements.
For example, comparing call volumes in April versus May can reveal whether initiatives implemented in April were effective.

- Use percentage or absolute change: Displaying data in terms of percentage change can provide a clearer picture of improvements or deteriorations.
For example, a 69% increase in call volume from one week to the next is more impactful than just stating the absolute numbers.

However, in some cases, showing absolute change might be more appropriate, particularly when absolute numbers are more meaningful for the context.

2. Top Reasons for Contact
Knowing the reasons behind your customer support calls is just as important as knowing the number of calls received (if not more so).
This qualitative data is essential for identifying areas that need improvement, as well as helping others in your organization plan future projects based on real customer needs.
Best Practices
- Create categories for contact reasons: Group contact reasons into logical categories such as billing, technical support, and general inquiries.
This makes it easier to identify and present which areas require attention.
SentiSum automatically groups contact reasons into these categories and provides clear tables you can drag and drop into your reports.
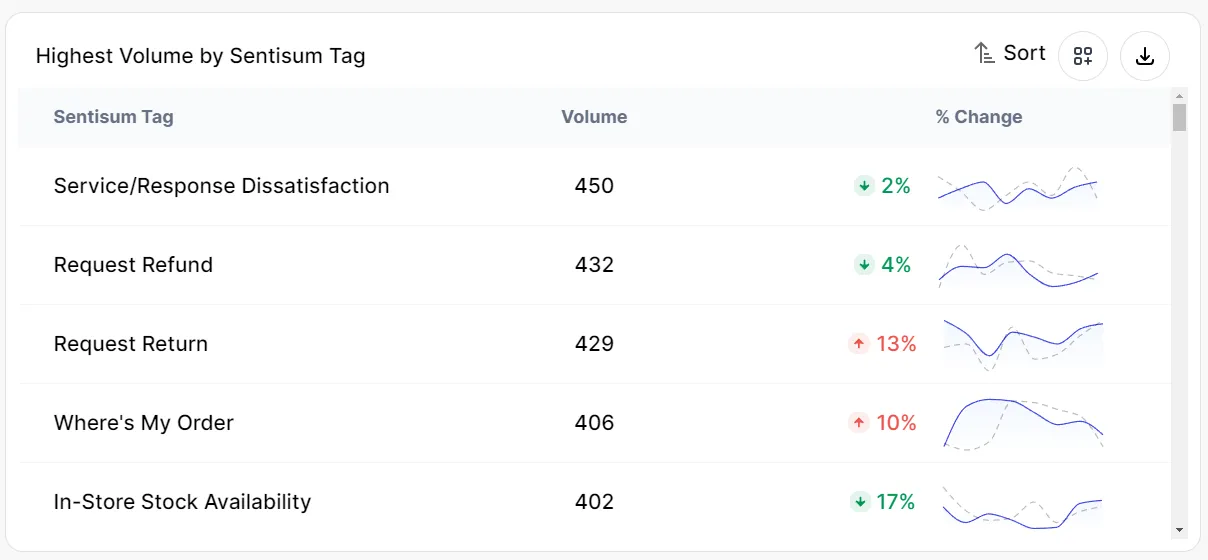
You can also look at the data in terms of average handle time to see if certain issues are being resolved faster than others.

- Visualize your data: Pie charts, bar graphs, and other visualizations make it easy for your team and other stakeholders to understand the distribution of contact reasons at a glance.
- Analyze trends over time: Including trend data on how contact reasons have evolved over time lets you identify emerging issues and track the progress of resolved problems.
Reporting on the topics with the highest volume of calls and percent changes over time can offer teams across your organization a quick snapshot of the most pressing customer issues.
- Contextualize your data: In a SentiSum podcast, Heidi El Hawary, Head of Customer Service at trivago, advised including qualitative customer quotes alongside quantitative data to make the numbers more relatable and impactful.
For instance, instead of stating that 400 customers complained about long wait times, a real customer quote can vividly illustrate the problem:

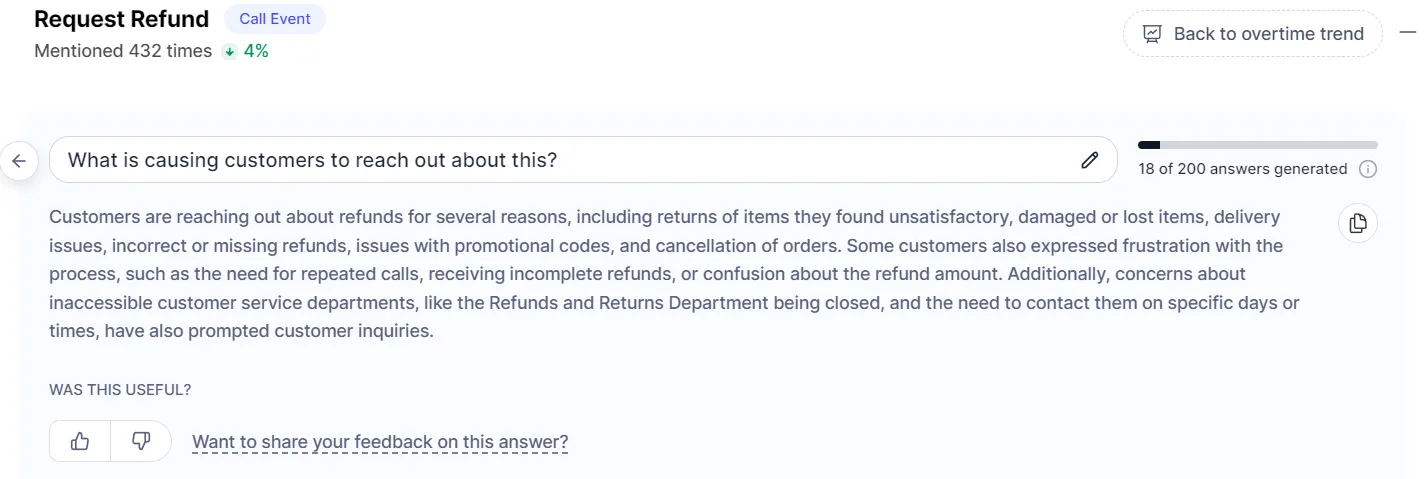
With SentiSum, you can click into each issue to quickly see and pull out customer quotes explaining why they’re contacting you.
SentiSum’s AI capabilities can also summarize the key reasons behind customer contacts, adding another layer of context to your reports.
Including these summaries can help your colleagues quickly understand the main issues without diving into the raw data.
3. Increases/Decreases in Contact
Changes in contact volume can indicate changes in customer preferences, product performance, or the impact of recent company initiatives.
For example, if your product team implemented an improvement initiative, tracking contact volume can show whether the issue has been effectively resolved.
Best Practices
- Use line graphs or bar charts: These types of visualizations make it easy to spot trends in contact volume.
- Highlight top increases and decreases: Increases in contact volume are warning signs of areas that require immediate attention.
SentiSum allows you to pinpoint which issues are escalating so you and your team can prioritize addressing them.

Conversely, the top decreases in contact volume can be showcased as wins for your team

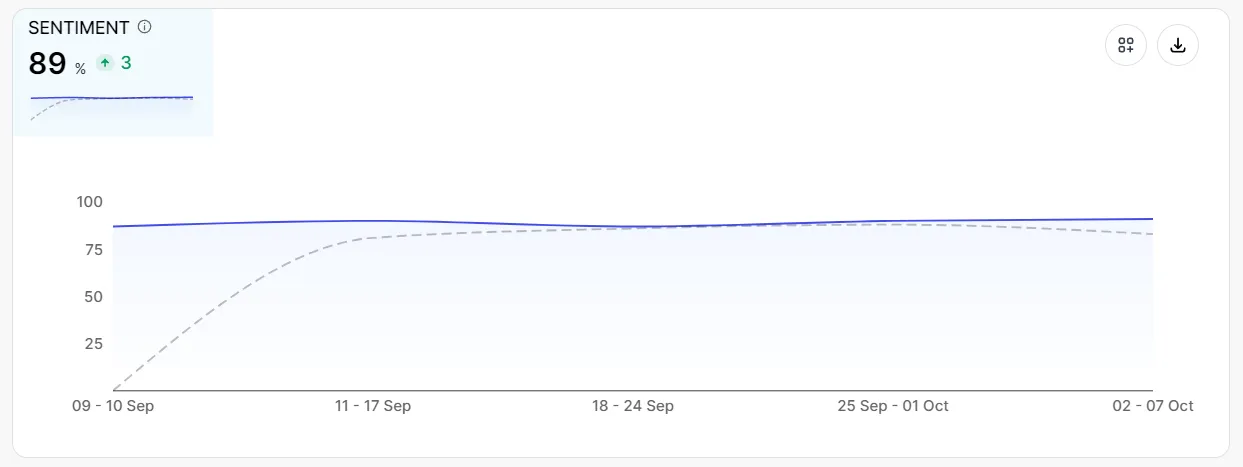
4. Customer Sentiment
Once you know why customers are reaching out, dig deeper to gauge how they feel about those interactions with your call center agents.
Reporting on customer sentiment gives you a holistic view of the customer experience, so your team can prioritize improvements based on emotional impact.
By doing this, you’ll create a more empathetic and responsive customer service environment, which ultimately leads to higher customer loyalty and retention.
Best Practices
- Analyze sentiment using a machine learning-based tool: Machine-learning algorithms can more accurately categorize emotions and learn from past data, giving you a comprehensive understanding of customer sentiment.
SentiSum’s advanced AI and machine learning-based natural language processing (NLP) capabilities can analyze customer sentiment across communication channels.
- Report on sentiment trends over time: Track and report sentiment trends over time to observe how customer feelings evolve.
This trend analysis is crucial for understanding the long-term impact of your customer service strategies.
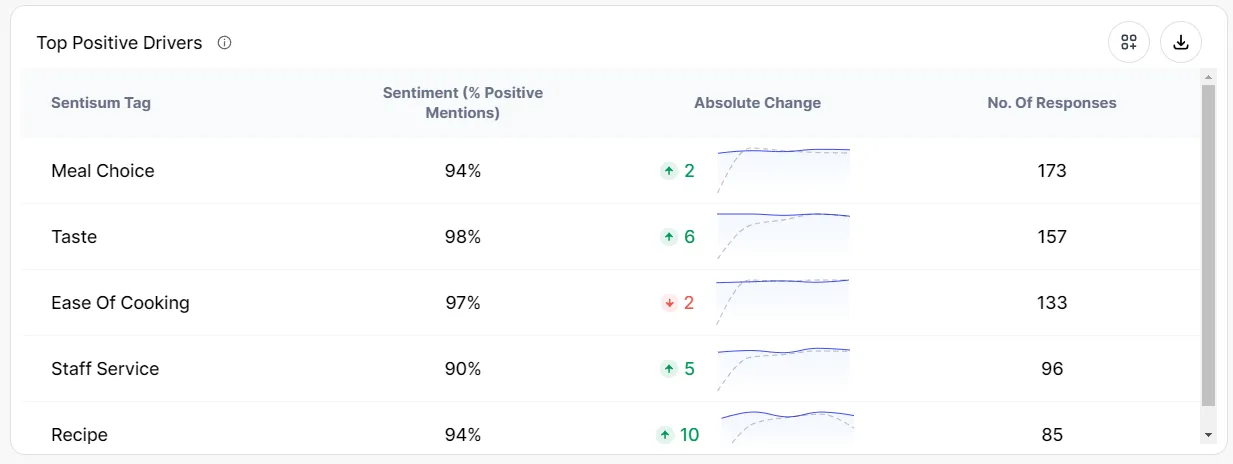
- Highlight top sentiment drivers: SentiSum can pinpoint which aspects contribute to positive experiences while also identifying negative sentiment drivers that need attention.
For example, your dashboard might highlight that quick resolution times are a significant driver of positive sentiment, while repeated issues or unresolved problems drive negative sentiment.
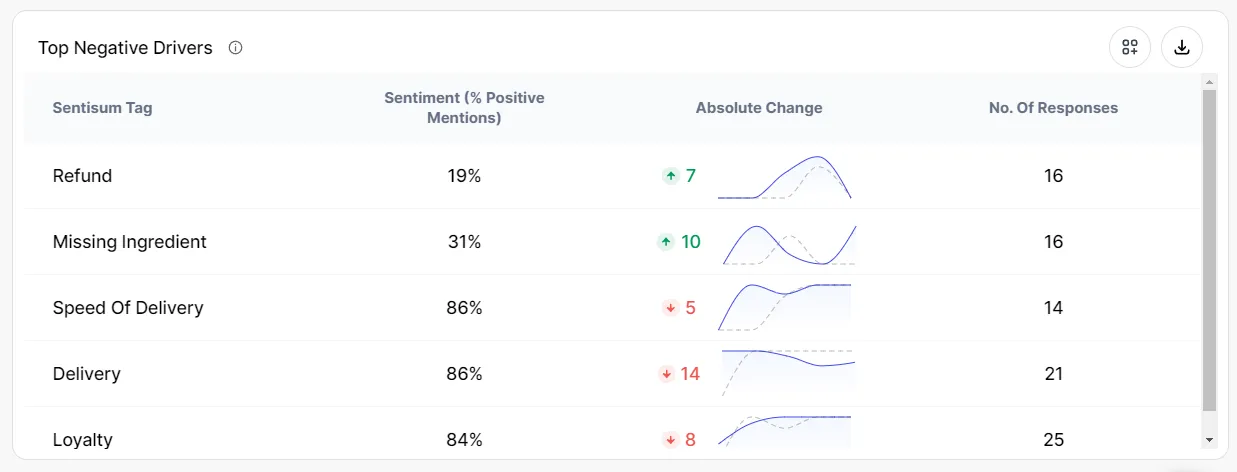
- Prioritize fixes based on sentiment data: Sentiment data is an excellent way to encourage other department to prioritize issues that drive negative sentiment. For instance, if several customers are expressing frustration over long wait times, this should be a priority for the team to address.
5. Customer Satisfaction Score (CSAT)
CSAT gauges customer satisfaction with the service provided by your call center agents, usually through post-interaction surveys or feedback.
Reporting on CSAT scores alone isn't enough, though.
By analyzing all customer conversations—emails, chats, calls, etc.—and cross-referencing data across channels, you can uncover the reasons why customers give high or low CSAT scores and make changes accordingly.
Best Practices
- Highlight survey scores and qualitative feedback: Pair pie charts or other visualizations of satisfaction ratings with qualitative customer feedback.
SentiSum’s tools can give you summaries of customer comments that explain the reasons behind their ratings so you can add valuable context to your reports.
Here’s an example of what that might look like:

- Analyze overall CSAT trends: Track CSAT trends over time to see how customer satisfaction evolves.
SentiSum’s trend analysis tools provide a clear view of these changes so you can quickly identify patterns and measure the impact of your initiatives.

- Identify top positive and negative CSAT drivers: Use side-by-side comparisons to highlight the top positive and negative drivers of CSAT.
In this SentiSum example from a meal kit delivery service, helpfulness and quick resolution times are top positive drivers, while missing ingredients is the top negative driver.

6. Net Promoter Score (NPS)
NPS is a commonly used survey that measures how likely customers are to recommend your company to others—a clear indicator of overall customer satisfaction and loyalty.
High NPS scores are associated with positive word-of-mouth and repeat business, while low scores can signal issues that may affect customer retention and growth.
Best Practices
- Understand key drivers behind NPS: As with CSAT, you’ll want to analyze the key drivers behind your NPS scores.
By understanding what influences customers to become promoters, passives, or detractors, you can take targeted actions to improve these scores.
SentiSum’s analytics tools can help you identify these drivers and give you more detailed insights into why customers gave the scores they did.


- Analyze NPS trends over time: Track NPS trends to see how customer loyalty changes over time and monitor the long-term impact of your customer initiatives.

7. Average Handle Time (AHT)
Average handle time gives you an idea of how long it takes for your agents to handle a single customer conversation from start to finish.
Reporting on AHT helps identify areas where processes can be streamlined to reduce the time agents spend on each call.
AI-powered conversation analytics software like SentiSum can make it much easier to analyze the root causes of outliers in AHT, so you and your team can make targeted improvements.
Best Practices
- Analyze AHT trends over time: Track AHT trends to observe efficiency improvements or identify elements of the process that need attention.
You can track these trends over daily, weekly, or monthly periods and compare them to see if AHT is increasing or decreasing over time.

- Break down AHT by agent: Analyzing AHT by individual agent helps identify top performers and those who may need additional training.
SentiSum’s detailed agent reporting offers insights into individual performance and areas for improvement.

- Run a root cause analysis: SentiSum’s AI capabilities can analyze the root causes and issues that lead to longer support calls.
Once you understand the factors driving high AHT, you can take specific actions to address them.
For example, if complex billing inquiries represent your longest AHTs, you can implement targeted training or streamlined processes to handle these queries more efficiently.
8. Customer Emotions
A related but separate metric from customer sentiment, customer emotion is how people feel during their conversations with your call center.
This is particularly helpful for assessing agent performance and developing your training programs accordingly.
Julie Miller, VP of product marketing at Clarabridge, wrote in a Customer Experience Magazine article:
“Emotions inspire customer decisions and impact long-range customer journeys. Brands can design and tailor programs—like marketing or training—when they can identify the emotions expressed in customer interactions and gauge the strength of their intensity.”
As Miller notes, understanding customer emotions provides valuable insights and a “framework for continuous improvement and consistent, modern customer experience.”
Best Practices
- Track emotional trends over time: SentiSum can generate graphs that display how customer emotions fluctuate over time and identify patterns.
For example, a happiness trend line can show whether customers are generally becoming more satisfied or if there are recurring issues causing frustration.

- Analyze emotions by agent: Breaking down emotional data by individual agent helps identify strengths and areas for improvement.
SentiSum’s detailed reports can show which agents consistently evoke positive emotions and which might need additional support with tailored training programs.

- Use emotions to drive cross-team improvements: Share emotional data with other teams to drive broader organizational improvements.
For instance, if customers frequently express frustration about a particular product feature, the product development team can prioritize making enhancements in that area.
Similarly, marketing teams can use positive emotional feedback to highlight strengths in their campaigns.
Book a demo with SentiSum below to make call center analytics and reporting easy ⤵️
Frequently Asked Questions
Call center analytics reporting involves collecting, analyzing, and presenting data from customer interactions within a call center.
This data includes both quantitative data (e.g., number of calls, average handle time, FCR) and qualitative data (e.g., customer sentiment, reasons for contact).
Tracking and reporting on call center metrics gives you and your team a deeper understanding of customer behavior, preferences, and pain points.
Tools like SentiSum can automate collecting and analyzing this data and help you build clear and actionable reports to share across your organization.
There are a few key reasons why you should prioritize good call center analytics reporting:
- You’ll drive action on customer experience and operational improvements. Customer service can be a valuable driver of organizational insights if you follow the right reporting practices.
Capturing and analyzing data from customer interactions allows you to identify key pain points and areas for improvement, and then present those findings for prompt action across departments.
- You’ll have better internal insights on customer surveys. NPS and CSAT surveys are common metrics for gauging customer happiness and loyalty.
Cross-referencing survey data with call center analytics reporting provides deeper insights into survey score trends.
For instance, if you notice a decline in scores over a specific period of time, call trend reports from the corresponding time frame can help you better understand the issues that were driving lower scores.
- You’ll improve core KPIs like First Reply Time and Resolution Time. The speed at which you reply to and resolve customers’ issues directly impacts overall satisfaction and loyalty.
Regularly reporting on these KPIs helps identify trends and assess the impact of improvement initiatives and projects so you can ensure your team is meeting (or exceeding) its goals.
By leveraging AI-powered tools like SentiSum, you can automate your call center analytics reporting process and know that your data is consistently accurate and up-to-date.
Explore Real Success Stories
Explore Success Stories
Talk to a Data Expert