We wrote about how to manually analyze support tickets in detail in our guide on Support Driven Growth.
There are four key steps:
1/ Collate your feedback data
Collect it in our free template here.
2/ Decide on your taxonomy
Categorising feedback isn’t always easy. Choose topics that are granular enough to be insightful but high level enough that you can draw out similarities. When dealing with high volumes of unstructured free text (such as customer support ticket logs) you’ll want to create both high-level themes and more granular sub-categories.
We have a complete guide to creating help desk ticket categories here.
3/ Start tagging your tickets
Add your tickets and categories to the spreadsheet. We suggest one person tags all the tickets to ensure objectivity—two people may interpret the same piece of text differently, categorising it differently.
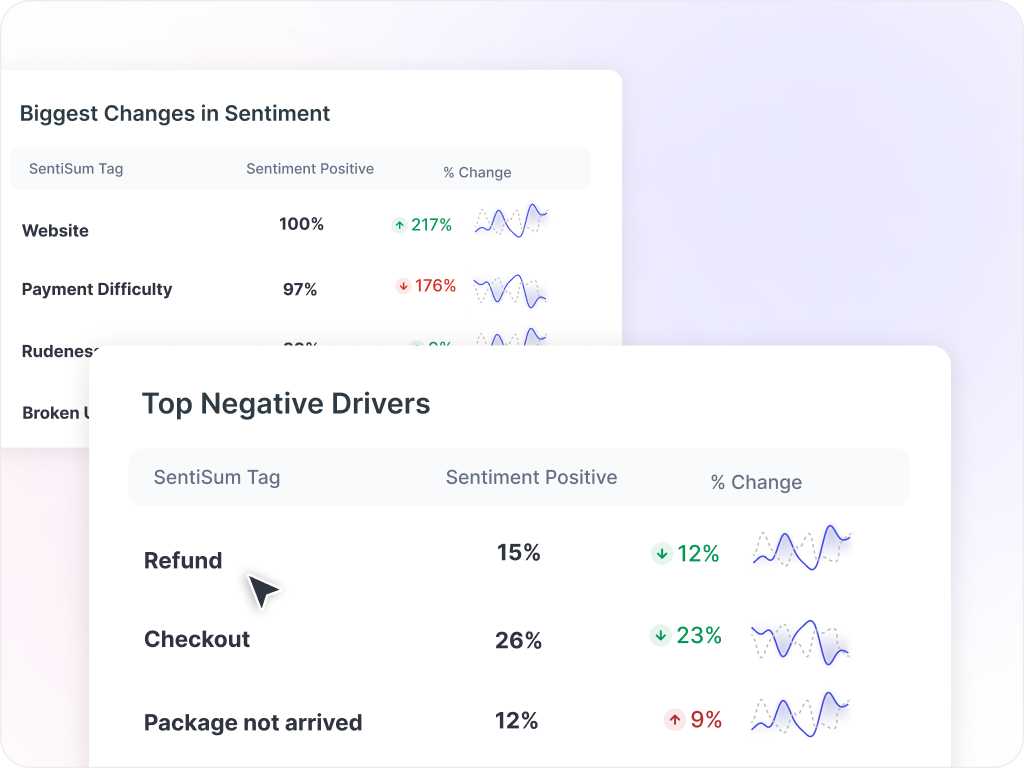
4/ Look for patterns and share insights
Apply filters to your spreadsheet to reveal which topics are mentioned in the highest volumes, and send the data off to the relevant team. The popularity of the theme and category can be a clear indicator of what needs prioritisation.
It's worth noting that we'd only recommend doing a manual support ticket analysis if you have a handful of tickets each month. Otherwise your insights will quickly become biased and non-useful.
.svg)
.svg)


.svg)
.webp)
.svg)
.webp)


.svg)


.svg)
.webp)